How Sustainable Is This Rally?
Published in Forbes.com on April 8th, 2020

Introduction
In my March 25th article for Forbes, entitled US Stocks: How Low Can You Go?, I pointed out that extremes in price momentum and volatility were characteristic of emerging intermediate term market bottoms. What I didn’t know at that time was that the benchmark S&P 500 (SPX) had already bottomed two days earlier, on March 23rd. The US broad market index has since risen by 26% into the April 7th highs.
Two weeks ago, the most frequent question I was getting from clients is “How low can the market go?”. Now everyone is asking “How sustainable is this rally?”
The current investing environment is probably the most difficult one of my career, just because of all the unknowns. The last pandemic was in 1918, and the world has changed a lot since then. Covid-19 is currently running rampant throughout the world and no one really knows when it will abate and, when it does, how — and when — global economies might recover, and change.
During my career — which has included the 1987 market crash, the Tech Bubble, 9/11, the 2008 Financial Crisis and everything in between — it has been at precisely these times that a data driven, follow-the-money approach has been the most useful, and prescient. This is simply because, although times, events, and conditions may change, how human beings react to fear and greed generally remain the same. It’s in our DNA.
The following is a basic, simplified explanation of Asbury Research’s approach and how we are utilizing it in today’s market. I hope it helps readers to look beyond the current maelstrom of news reports, opinions, and human emotions and to follow the money to better, data driven investment decisions.
Step #1: Know Where The Key Levels Are
In my view, the first thing you have to do – regardless of whether you’re a short term trader or long term investor – is to determine where the key price levels are in the index or stock you’re interested in. Chart 1 identifies these potential inflection / decision points in SPX, both above and below the market. The chart shows that the current rally in the benchmark S&P 500 (SPX) was triggered by a successful March 23rd test of 2193 — which is important underlying support at the August 2016 high.
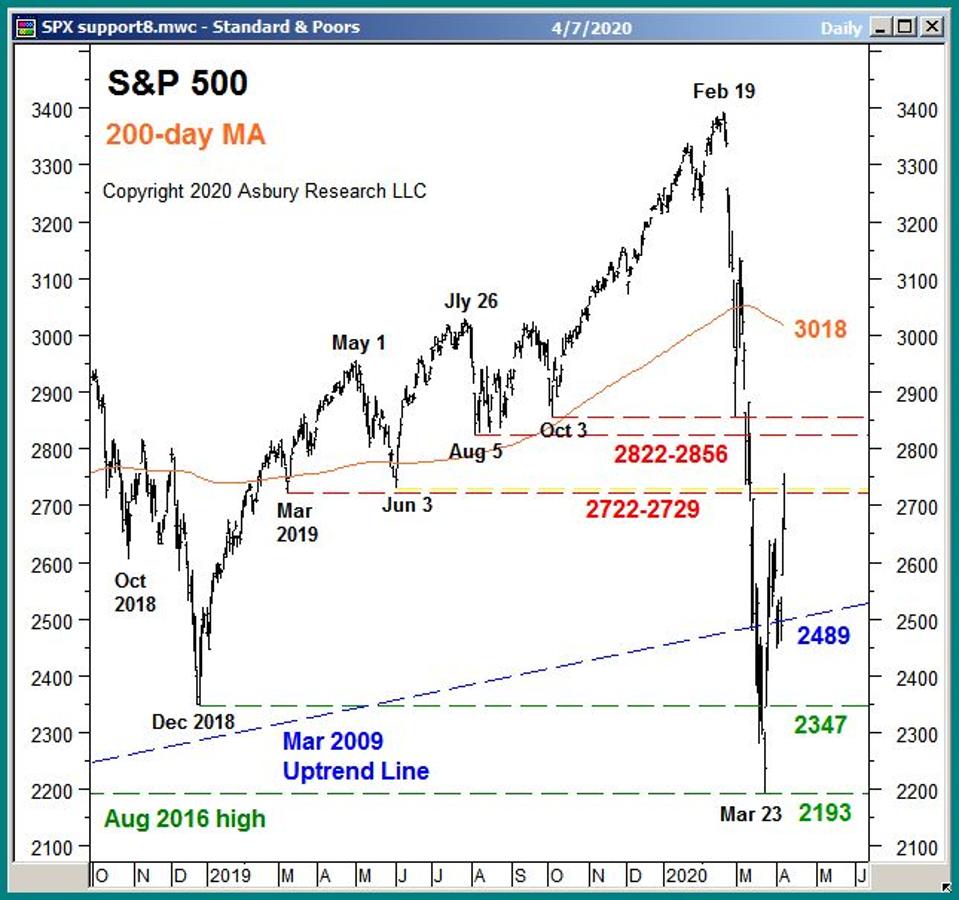
Chart 1
Copyright 2020 Asbury Research LLC
The chart also shows that the subsequent rally has resulted in a test of primary overhead resistance at 2722 to 2729 (red highlights), the March and June 2019 lows.
I use charts like this one as dynamic “game boards, to help determine – ahead of time — where to potentially move capital in and out of the market. This test of overhead resistance sets up another directional decision point for the US broad market.
Step #2: Know What To Do At The Key Levels
Identifying the key market levels, in advance, is a great first step. But, after that, you need a consistent, objective, and repeatable process to tell you what to do there (buy or sell) and when to do it. Many investors believe that just getting the direction right in a stock or index is the secret to making money in the market. I disagree. That’s actually the easy part. The hard part is defining the risk-reward parameters of each entry and exit that we make, to make sure they are in our favor.
There is no one-size-fits-all way to do this, or one magic tool to use, because no single metric is the holy grail — and everyone has their own risk appetite and investment time horizon. The good news, though, is that most online charting packages have a broad list of indicators that can be used for this purpose. The trick is, just like a carpenter building a house, to know which tool to use for what job. I have found that utilizing a combination of indicators, rather than any individual one, does a much better job of tackling the “what to do and when to do it” part of the equation.
To accomplish this, my firm Asbury Research utilizes two in-house tactical models — the Correction Protection Model (CPM) and the Asbury 6. The Asbury 6 is a combination of six diverse market metrics that we use as a lie detector test for the market — to help identify real, sustainable market advances or declines from computer-driven traps for investors.
We created the “A6” primarily because algorithmic trading now accounts for about 80% of the daily volume in the US stock market. And, in our view, many of these computer-generated trading programs are designed to prey on investors by causing quick, sharp moves in financial asset prices that provoke people to make emotionally driven, ill-timed trading decisions — at exactly the worst possible times and places. The “A6” uses six different inputs – only one which is price-based, on purpose – to help screen out those false signals.
Table 1 below shows that, through the close on Monday (April 6th), three of the Asbury 6 have recently moved back to a Positive reading. Since four or more metrics in one direction, either Positive (green) or Negative (red), are necessary to indicate a tactical bias, our model still retains its February 24th Negative status.
However, the model is now at a balance point. This is important.
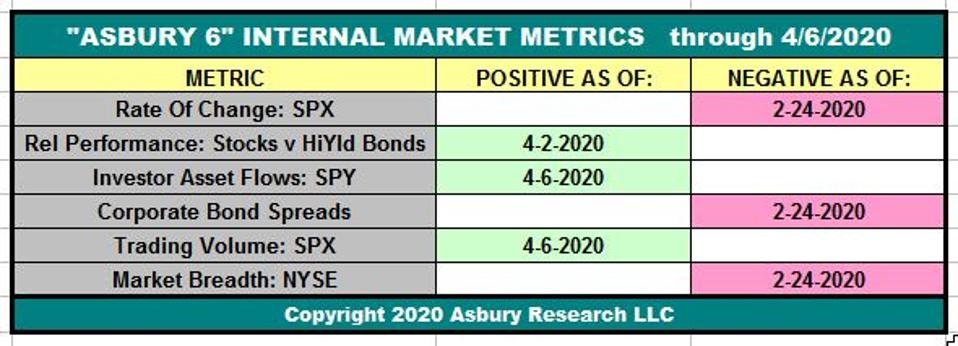
Table 1
Copyright 2020 Asbury Research LLC
This equally balanced status of the model suggests that the US stock market is at a tactical inflection point. The next step is to attach this condition in our model to a specific price level and, per Chart 1 above, that price level appears to be SPX 2722 to 2729.
Step #3: Make Data Driven Decisions
Since no one can see the future, knowing that the market is at an inflection point – and knowing where that inflection point is — is the next best thing. From here, we will be closely watching how our tactical models react over the next few days, as an indication of whether SPX 2722 to 2729 will hold as resistance and potentially trigger a retest of the late March lows, or be broken to the upside to clear the way for a potential test of the next overhead level at 2822 to 2856.
You can sign up for Asbury Research’s free Bi-Weekly Stock Market Update by Clicking Here. The accompanying video in that report shows how we use our methodology and models to navigate the markets in real time.